
20 Oct 2026
Close to 40% of S&P 500 stocks declined in the third quarter while the index rose, and what a narrow market means for portfolios
The third quarter of 2026 put global equity markets through a macroeconomic stress test. While a sudden spike in global bond yields pressured valuations across smaller, debt-sensitive corporations, global large-cap stock markets demonstrated remarkable strength.
Driven by strong nominal economic growth and a structural corporate capital expenditure (CapEx) boom, equity markets managed to remain flat or post positive returns rather than buckle under restrictive interest rate pressures.
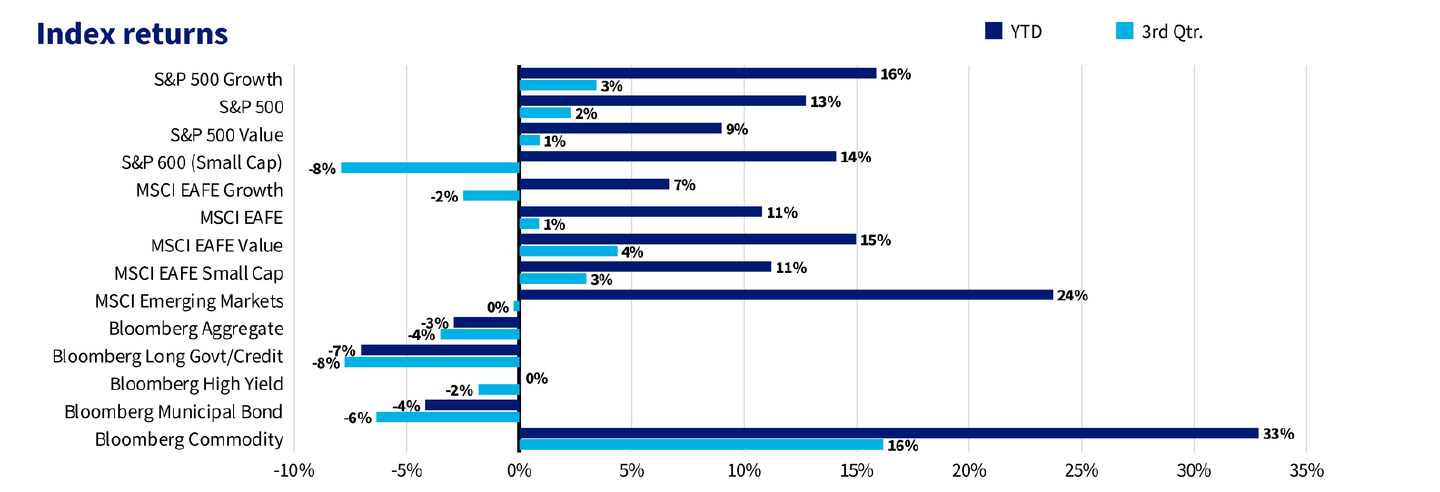
Equities: surprisingly resilient, ending September 30, 2026. Source: YCharts. Data as of September 30, 2026.
Large-Cap Stocks: Driven by Strong Economy & Earnings
Typically, a rate shock of this magnitude triggers a broad equity liquidation. Instead, core large-cap indexes demonstrated resilience during the quarter, absorbing the rate spike through strong underlying corporate fundamentals and earnings. But there is far more to this story. First, the basics:
- AI cycle outperforming expectations: With S&P 500 earnings at approximately 50% year over year in the third quarter, it has become apparent that the AI boom is not likely to let investors down. It is more likely that investors are underestimating the growth potential of this cycle.
- The growth engine: Resilient consumer demand and a robust economy allowed large companies to pass along higher costs, expand top-line revenue, and generate earnings on a spectacular level.
- The CapEx floor: A generational corporate spending boom in AI infrastructure, data centers, and domestic manufacturing reshoring created an insulated layer of corporate demand. Large-cap technology and industrial firms utilized their massive balance sheets and cash flow to fund these multibillion-dollar projects without relying too much on expensive debt markets.
What Really Drove the Performance of U.S. Stocks This Quarter: The Magnificent 7
Beneath the surface of large-cap indexes, a dramatic capital rotation completely flipped the market dynamics that defined the first half of the year.
- The Q2 semiconductor regime: In the second quarter, “long global semiconductors” became the most crowded trade on Wall Street. Chasing a memory shortage and extreme pricing power, capital aggressively piled into chipmakers and hardware suppliers. This massive concentration came directly at the expense of software companies and select components of the Magnificent 7 (like Microsoft and Alphabet), which were treated as funding vehicles to reallocate capital to semiconductors.
- The great reversal: In the third quarter, this exact trade inverted as chip stocks lost their froth. A massive capital rotation forced an exit from overcrowded semiconductor positions and redirected money straight back into the relative safety of large software platforms and cash-generative Magnificent 7 stocks.
Magnificent 7: Apple (AAPL), Microsoft (MSFT), Alphabet (GOOGL), Amazon (AMZN), Meta Platforms (META), Nvidia (NVDA), and Tesla (TSLA).
The Net Result: A Return to a Narrow Market
Overall, the U.S. market exhibited remarkably narrow market breadth this quarter. Rarely do I encounter a new way of looking at the market, but this quarter, “negative beta” became a thing. In this context, the term “negative beta” is being used to describe stocks that declined while the overall market rose. The S&P 500 Index has become so concentrated that close to 40% of S&P 500 stocks declined in the third quarter, while the overall market rose. This simply means that investors sold large swaths of stocks to buy just a few, and this quarter the Magnificent 7 stocks were the recipients of this tide.
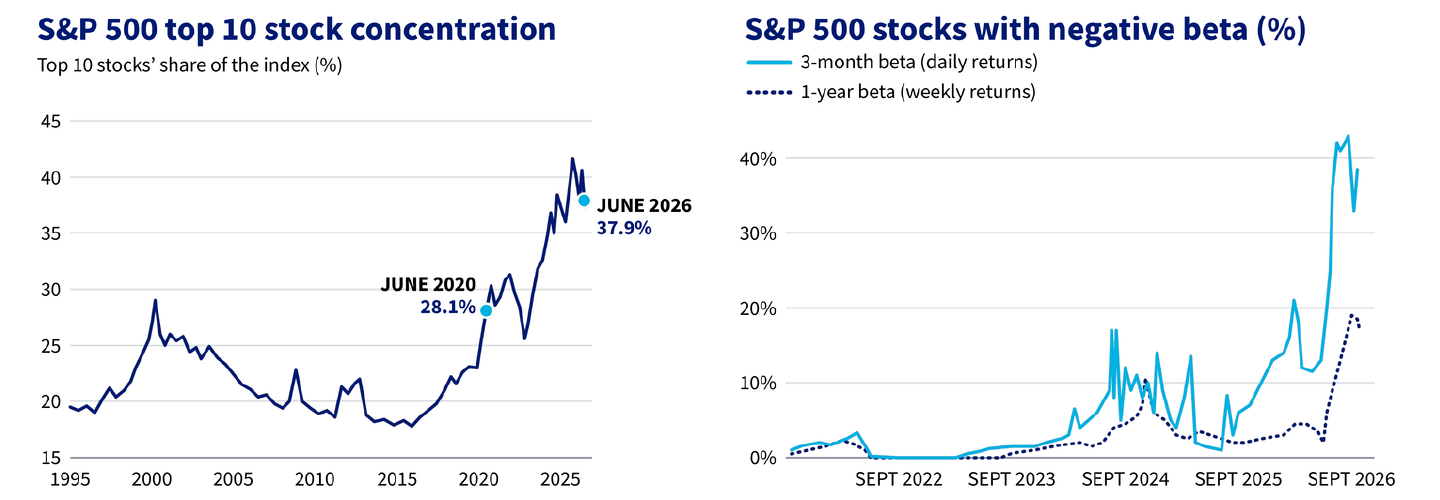
S&P 500 top 10 stock concentration and S&P 500 stocks with negative beta. Source: MFS Global Outlook August 2026. CNBC “Nearly half the stocks in the S&P 500 are at cross purposes with the rest of the market,” September 28, 2026.
Small-Cap Stocks: Acting Normal, Despite Losses
Small-cap equities responded to this quarter’s macroeconomic pressures, because stocks typically fall in the face of rising interest rates. However, the Magnificent 7 Stocks supported large cap indexes, while the rest of the market struggled. Small-cap stocks indexes do not include large-cap tech stocks, and therefore the indexes represent how interest rates affect the average stock.
- Perception vs. reality: Smaller businesses are thought to be largely locked out of the cap-ex cycle. However, that means that they are under less pressure to spend on giant expansion projects, and are also beneficiaries of CapEx. Further, the strong economy can have a magnified impact on small businesses’ bottom lines.
- Knee-jerk response vs. long-term growth: In the short run, flows of capital rule pricing, and market participants can shoot first and ask questions later. During the quarter, something had to take the brunt of interest rates rising.
- Bigger picture: Despite the sharp quarterly sell-off, small caps are still performing in line with the venerable S&P 500 Index this year, as small-cap stocks are significant beneficiaries of the strong economy, maintain attractive valuations, and are performing at the corporate level.
Portfolio Positioning
Important portfolio attributes include:
- Underweight large-cap stocks: Most Frontier Strategies remain relatively underweight U.S. large-cap stocks.
- International stocks: Frontier holds near-benchmark positions to international stocks but also maintains unique exposures to international small-cap stocks and emerging markets.
- Small-cap stocks: Most Frontier Strategies maintain measured overweights to small-cap stocks.
Performance Highlights
The third quarter was marked by narrow market leadership in the U.S., poor returns for small-cap stocks, and losses in fixed income. Most Frontier Strategies came in slightly below their benchmarks for the quarter, but results were close to 0% return, and manager positioning helped offset the challenges of narrow market breadth, small-cap stock performance, and bond losses.
Despite being slightly overweight in small-cap stocks, portfolios overall were largely unhindered by the losses. For example, the Global Opportunities Strategy, which generally holds close to 40% U.S. small-cap stocks, returned nearly 0% for the quarter despite small-cap indexes losing close to 8%.
Alternative strategies: Victory Market Neutral has gained over 10% year to date.
Read the full October 2026 Monthly Briefing
Quick answers
What does negative beta mean for stocks?
In this context, the term “negative beta” is being used to describe stocks that declined while the overall market rose. In the third quarter, close to 40% of S&P 500 stocks did exactly that.
What drove U.S. stock performance in the third quarter?
A dramatic capital rotation. In the second quarter, “long global semiconductors” became the most crowded trade on Wall Street. In the third quarter that trade inverted as chip stocks lost their froth, and money moved back into large software platforms and cash-generative Magnificent 7 stocks.
How concentrated is the S&P 500?
The top 10 stocks accounted for 37.9% of the index as of June 2026, up from 28.1% in June 2020. The index has become so concentrated that close to 40% of its stocks declined in the third quarter while the overall market rose.
How did small-cap stocks perform in the third quarter?
Small-cap indexes lost close to 8% for the quarter, as something had to take the brunt of interest rates rising. Even so, small caps are still performing in line with the S&P 500 Index this year.
Frontier does not provide tax or legal advice. Please consult with a licensed professional for recommendations pertaining to individual circumstances.
Past performance is no guarantee of future returns. Performance shown represents total returns that include income, realized and unrealized gains and losses. Nothing presented herein is or is intended to constitute investment advice or recommendations to buy or sell any types of securities and no investment decision should be made based solely on information provided herein. There is a risk of loss from an investment in securities, including the risk of loss of principal. Different types of investments involve varying degrees of risk, and there can be no assurance that any specific investment will be profitable or suitable for a particular investor’s financial situation or risk tolerance. Frontier is not responsible for any trading decisions, damages or other losses resulting from this information, data, analyses, opinions or their use. Diversification does not ensure a profit or protect against a loss. All performance results should be considered in light of the market and economic conditions that prevailed at the time those results were generated. Before investing, consider investment objectives, risks, fees and expenses.
Frontier Asset Management LLC is a Registered Investment Adviser with the Securities and Exchange Commission. The firm’s ADV Brochure and Form CRS are available at no charge by request at info@frontierasset.com or 307.673.5675 and are available on our website www.frontierasset.com. They include important disclosures and should be read carefully.