
19 Aug 2026
What rising bond yields and July's data mean for your portfolio
Inflation pressure picked back up in July even though the Federal Reserve held rates steady, and bond investors are the ones flashing the warning light. Long-dated Treasury yields pushed toward levels not seen in 19 years, a sign that the market, not just the Fed, is now setting the price of money.
Commodity prices: Bloomberg Commodity Index up 36% over the past year
Commodity price inflation continued in July, and several long-term headwinds remain:
- Supply shocks and shortages: oil supply from the Gulf remains constrained.
- Global technology capex and energy infrastructure buildouts are significantly increasing demand.
- Monetary and fiscal policies are driving currency hedging and increasing demand for precious metals.
- An inflation spiral is causing inventory storage, transportation, and extraction costs to rise.
| Commodity | July Return | 1-Year Return |
|---|---|---|
| S&P GSCI Aluminum | 3% | 30% |
| S&P GSCI Brent Crude | 21% | 57% |
| S&P GSCI Copper | 3% | 48% |
| S&P GSCI Gold | 2% | 22% |
| S&P GSCI Natural Gas | -16% | -24% |
Source: YCharts. Data as of July 31, 2026.
Inflation: July CPI Nowcast at 0%, 12-month rate at 3.4%
Wars, a weak dollar, tariffs, global trade friction, geopolitical tensions, rising input and labor prices, and ongoing monetary and fiscal stimulus are all conspiring to keep inflation above a neutral rate. However, inflation pressures have subsided considerably since late June.
The Economy: ISM Manufacturing PMI near a four-year high
Rising asset prices and a global capex boom are driving coordinated global growth. Employment, manufacturing, consumer spending, and government spending all remain strong, continuing to fuel a strong economy.
Earnings: S&P 500 earnings growth estimated at 23% year-over-year
Corporate earnings grew at the fastest pace in five years during this reporting season, and this wasn’t just for the headline tech names. The often-overlooked small-cap space is expected to far outpace its more popular large-cap brethren, with the Russell 2000 expecting to deliver year-over-year earnings growth of 44%. International stocks are not being left behind either, with earnings growth expected to range between 15 and 20%. These earnings results are the story behind the story for equity outperformance.
Interest Rates: 30-year Treasury yields near a 19-year high
The obvious risk to rising asset prices, a strong economy, and higher commodity prices and inflation is higher interest rates.
How are stocks reacting?
With explosive growth in semiconductor and AI-related stocks this year, investors’ general fear of losing money has now been replaced with, “I just want to keep up,” or worse, “I just want in on the new hot thing.”
That appears to have been the prevailing mindset until July, when investor exuberance was tamed and rationality returned to the fray. Investors decided that enough was enough for this AI rally, for now, and semiconductor stocks sold off over 20%.
In its simplest form, the S&P 500® gained nothing in July, but beneath the surface, growth stocks lost ground while value stocks posted gains.
- Tech stock leadership has become fractured: investors are becoming more discerning about which tech companies they own. It is no longer enough to just index the sector. This year has produced major performance differences between the Magnificent Seven hyperscalers, semiconductor companies, memory manufacturers, and software firms, which are all tech stocks. In July alone, in a reversal of fortunes, the iShares Software ETF outperformed the iShares Semiconductor ETF by 25%.
- Value greater than growth: value stocks outperformed growth stocks for July as money flowed from the AI trade into fundamentally undervalued areas of the market. More importantly, value stocks provided investors with meaningful diversification and a way to capitalize on changing market leadership.
- Small-cap resurgence: small-cap stocks are experiencing a quiet resurgence. While loud voices have been calling for the demise of small-cap stocks, the S&P 600 is up over 20% this year and 35% for the one-year period ending July 2026. That exceeds the performance of the S&P 500 Growth Index by roughly 10% over both periods.
- Emerging markets: emerging market stocks are suffering from the same issue as many indexes in this momentum environment, increasing concentration in technology stocks. With the AI trade faltering for the month, it’s no surprise that the emerging markets experienced marginal losses for the month.
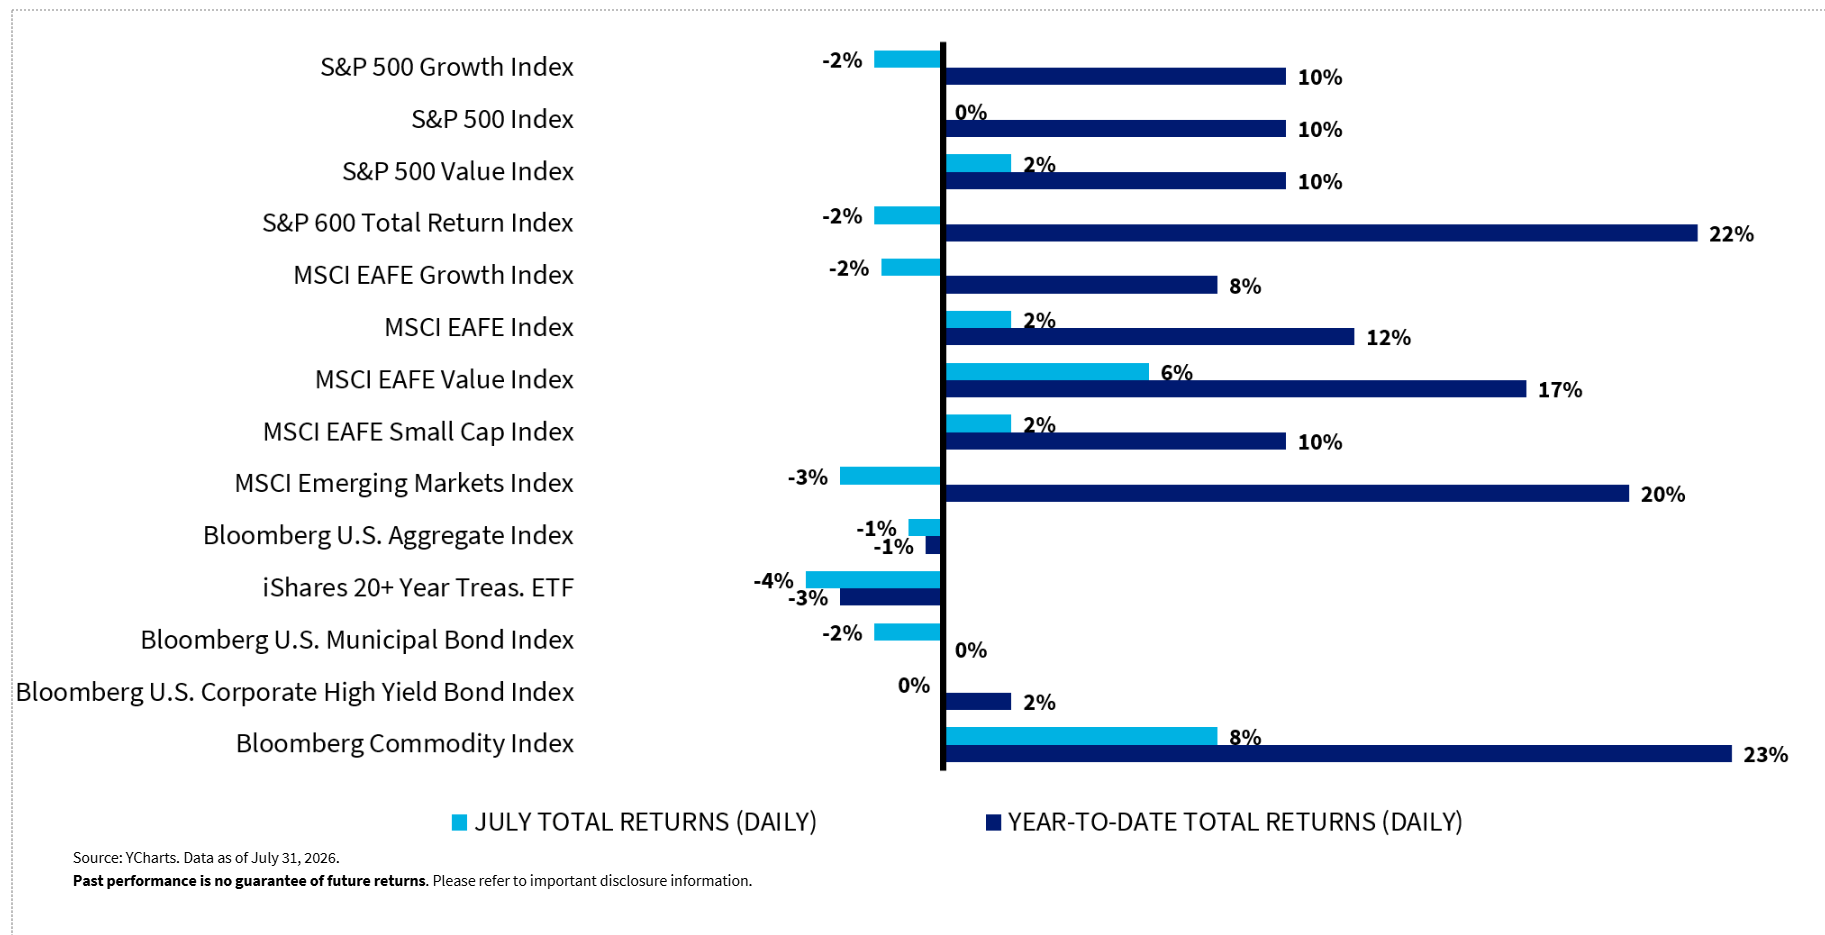
Equities: sloshing between momentum and fundamentals. Source: YCharts, data as of July 31, 2026.
What’s happening with bond yields?
The bond market faced a sharp reversal in sentiment as early optimism for interest rate cuts was dismantled by evidence of “sticky” inflation. This triggered an abrupt adjustment of expectations, forcing long-dated Treasury yields over the pivotal 5% level. Over the past six months, investors have had to reconcile themselves to a “higher-for-longer” Federal Reserve and renewed inflationary pressures.
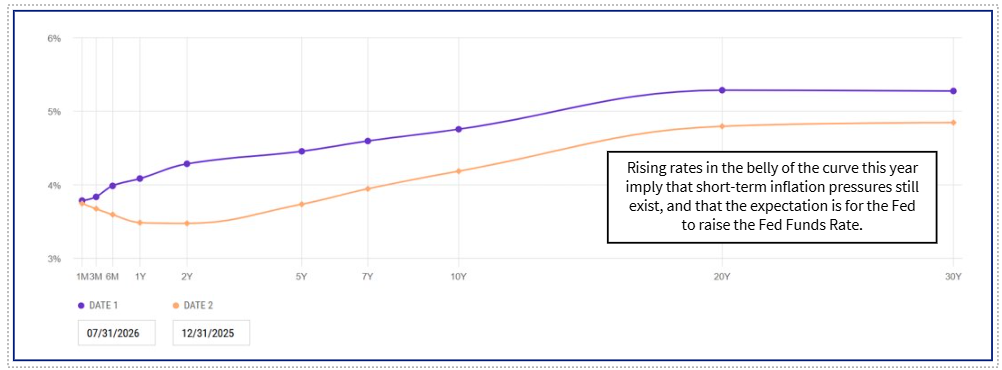
U.S. Treasury yield curve change: the market driving rates higher. Source: YCharts, data as of July 31, 2026.
Inflation pressures returned in July, and long-run higher-for-longer forces still exist:
- Commodity prices: rising raw material and energy costs are driving structural, sticky inflation.
- Growing isolationism: deglobalization and trade protectionism permanently increase manufacturing and labor costs.
- Bond vigilantes: investors are demanding higher yields to compensate for massive government deficits, forcing the Fed’s hand.
- Booming economy and stock market: robust consumer spending and strong corporate earnings give the Fed room to tighten policy without triggering an immediate recession.
Most of the actively managed fixed income funds used in Frontier portfolios continued to navigate this environment well. This is largely due to:
- Indexes maintain constant durations, while active managers can lower duration.
- Sector divergence: while the broad Bloomberg U.S. Aggregate Bond Index has been flat, credit-sensitive sectors such as high-yield bonds and bank loans have remained resilient, supported by a strong economy.
- Security selection: if investors all index at the same time, this can leave grand swaths of the market with mispriced securities.
Despite creeping up, yields remained surprisingly subdued. The U.S. bond market has remained quite resilient over the last six months, given the renewed inflation concerns and increased government borrowing.
Quick answers
Why are bond yields rising in 2026?
Long-dated Treasury yields are climbing as higher-for-longer inflation expectations return, driven by sticky commodity prices, deglobalization-driven cost increases, and investors demanding more compensation to fund rising government deficits.
Is the Fed behind the curve on inflation?
It’s a live risk. The Fed held rates steady in July even as commodity prices (like copper, up 47% over the past year) and a 3.4% 12-month CPI rate suggest inflation pressure hasn’t fully faded.
Are value stocks beating growth stocks right now?
Yes, on a monthly basis. In July, value stocks gained while growth stocks lost ground, part of a broader rotation as money moved out of momentum-driven tech trades and into more fundamentally priced areas of the market.
Why are small-cap stocks outperforming large-cap growth stocks?
The S&P 600 (small-cap) is up more than 20% year to date and 35% over the past year, outpacing the S&P 500 Growth Index by roughly 10% over both periods, as market leadership broadens beyond mega-cap tech names.
Frontier does not provide tax or legal advice. Please consult with a licensed professional for recommendations pertaining to individual circumstances.
Past performance is no guarantee of future returns. Performance shown represents total returns that include income, realized and unrealized gains and losses. Nothing presented herein is or is intended to constitute investment advice or recommendations to buy or sell any types of securities and no investment decision should be made based solely on information provided herein. There is a risk of loss from an investment in securities, including the risk of loss of principal. Different types of investments involve varying degrees of risk, and there can be no assurance that any specific investment will be profitable or suitable for a particular investor’s financial situation or risk tolerance. Frontier is not responsible for any trading decisions, damages or other losses resulting from this information, data, analyses, opinions or their use. Diversification does not ensure a profit or protect against a loss. All performance results should be considered in light of the market and economic conditions that prevailed at the time those results were generated. Before investing, consider investment objectives, risks, fees and expenses.
Frontier Asset Management LLC is a Registered Investment Adviser with the Securities and Exchange Commission. The firm’s ADV Brochure and Form CRS are available at no charge by request at info@frontierasset.com or 307.673.5675 and are available on our website www.frontierasset.com. They include important disclosures and should be read carefully.